
Observing AI agents and MCP tool calls, end to end
Trace multi-step agent runs, tool failures and runaway loops with OpenTelemetry and Grafana. A runnable demo, five production scenarios, and the practices that keep agents observable.

I asked an AI agent a simple on-call question: is the checkout service healthy? It called a tool, got the answer "deployment pending", and called the same tool again. And again. Thirty times. Every call succeeded. The HTTP status was 200 the whole way through. The run took 20 seconds and burned about 95,000 input tokens, roughly fourteen times what a normal run costs.
Nothing in a classic service dashboard would have flagged it. Latency was fine, the error rate was zero, and the agent eventually answered. This is the problem with agents: their worst failures look like success to the tools we already have.
This article shows how to make an agent's behaviour visible, from the first prompt to the last tool call, using open standards and the Grafana stack your on-call team probably already runs. Everything here is in a runnable demo, so you can reproduce each scenario on a laptop in about five minutes.
What you'll build
The demo repository is AI-Platform-Engineering-Labs/observing-ai-agents-mcp. It contains:
- An agent (
sre-copilot) written in Python that answers on-call questions by calling tools. - An MCP server (
mcp-ops-tools) that exposes three tools over MCP, the Model Context Protocol:get_service_status,query_metricsandsearch_runbooks. - A mock LLM by default, so the demo is free, deterministic and needs no API key. Set
LLM_MODE=anthropicto use a real Claude model instead. - The observability stack in Docker Compose: the OpenTelemetry Collector, Tempo for traces, Loki for logs, Prometheus for metrics, and Grafana with a provisioned dashboard and alert rules.
sre-copilot (agent) ──stdio/MCP──> mcp-ops-tools (tool server)
        │                                  │
        └──────── OTLP ────────┬───────────┘
                               v
                    OpenTelemetry Collector
                 ┌─────────────┼─────────────┐
                 v             v             v
               Tempo          Loki      Prometheus
              (traces)       (logs)      (metrics)
                 └─────────────┼─────────────┘
                               v
                     Grafana: dashboard + alerts
Prerequisites
You need Docker with Compose v2 and at least 4 GB of memory for containers. On a Mac, Docker Desktop, OrbStack or Colima all work. You don't need an API key unless you want to run a real model.
git clone https://github.com/AI-Platform-Engineering-Labs/observing-ai-agents-mcp.git
cd observing-ai-agents-mcp
make up
Open Grafana at http://localhost:3000. The AI Agent Observability dashboard is the home page. The agent generates light background traffic every 15 seconds, so panels fill in after a minute or two.
Why agents need different observability
You already trace HTTP services. An agent is different in four ways that matter for on-call:
- It decides its own control flow. The same request can take 4 steps today and 30 tomorrow. You can't read the code and know the path; you have to record it.
- Its worst failure returns 200. A loop, a wrong tool, or an agent that gives up and answers vaguely all look like success at the HTTP layer.
- Cost is a reliability signal. Every step re-sends the whole conversation, so input tokens grow with every loop iteration. A runaway agent shows up on your bill before it shows up on your error rate.
- The work crosses process boundaries. The agent calls an LLM API and one or more tool servers. If context isn't propagated into those calls, each one becomes a separate, orphaned trace.
So the goal is simple to state: one agent run should be one trace, with every LLM call and every tool call inside it, including the spans recorded by the tool server.
The mental model: a run is a trace
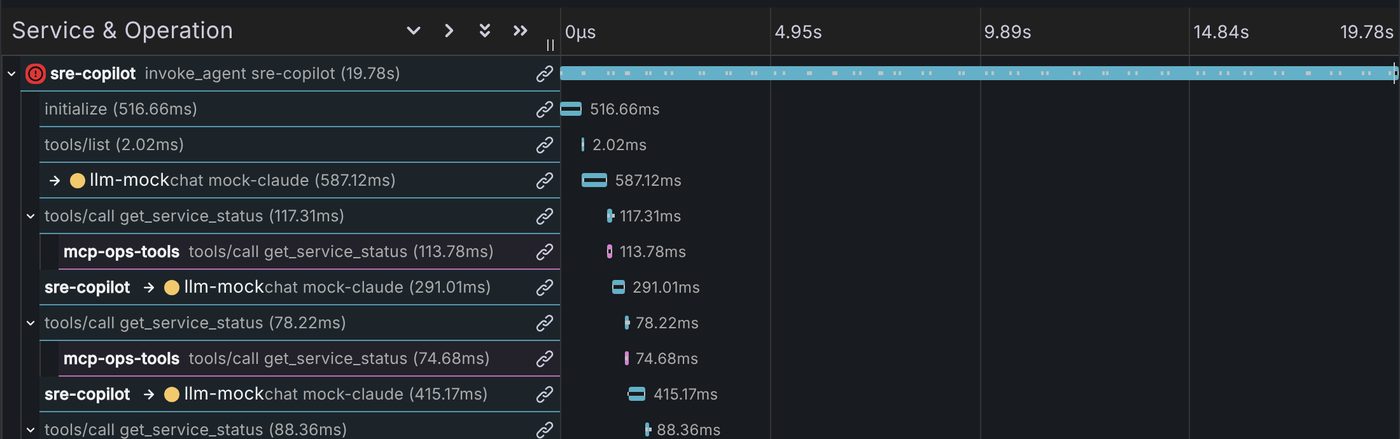
Here is the shape of a healthy run in the demo. It takes four LLM round trips and three tool calls.
invoke_agent sre-copilot                        (root span, one per run)
├─ chat claude-opus-5-5                         (LLM call: model, tokens, finish reason)
├─ tools/call get_service_status                (CLIENT span in the agent)
│  └─ tools/call get_service_status             (SERVER span in the MCP server, same trace)
├─ chat claude-opus-5-5
├─ tools/call query_metrics
│  └─ tools/call query_metrics
├─ chat claude-opus-5-5
├─ tools/call search_runbooks
│  └─ tools/call search_runbooks
└─ chat claude-opus-5-5                         (final answer, no tool calls)
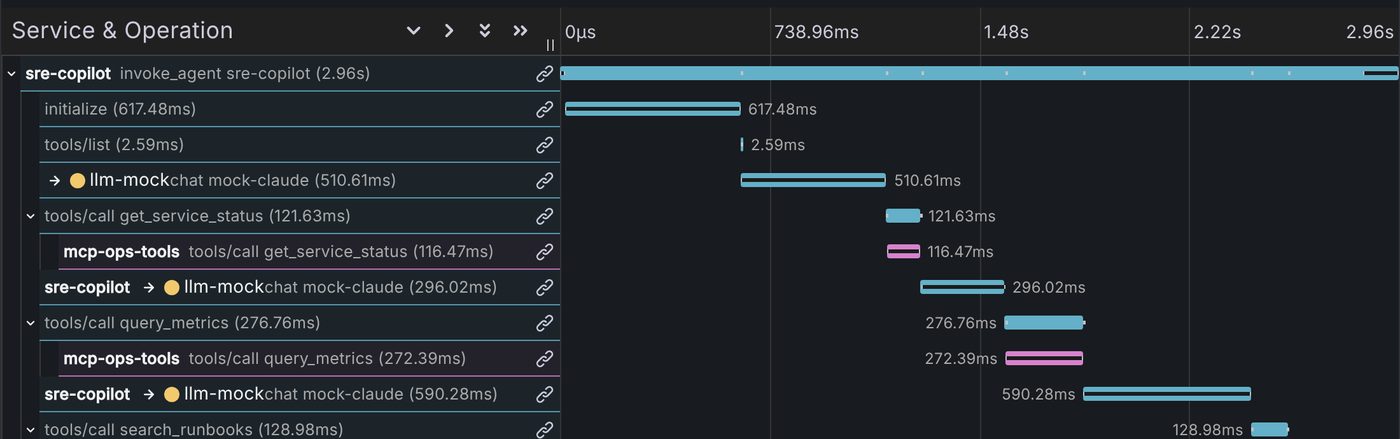
If you remember one picture from this article, make it this waterfall. Every scenario below is a variation of it.
Use the open conventions, not your own names
OpenTelemetry publishes semantic conventions for generative AI, including agent spans and MCP. Using them means any backend, and any teammate, can read your telemetry without a decoder ring. The demo uses these names:
| What | Span name | Key attributes |
|---|---|---|
| One agent run | invoke_agent {agent} |
gen_ai.operation.name = invoke_agent, gen_ai.agent.name |
| One LLM call | chat {model} |
gen_ai.provider.name, gen_ai.request.model, gen_ai.usage.input_tokens, gen_ai.usage.output_tokens, gen_ai.response.finish_reasons |
| One tool call | tools/call {tool} |
gen_ai.operation.name = execute_tool, gen_ai.tool.name, gen_ai.tool.call.id, mcp.method.name = tools/call |
The standard metrics are gen_ai.client.token.usage (a histogram split by gen_ai.token.type of input or output) and gen_ai.client.operation.duration. For MCP timing, the demo records mcp.client.operation.duration on the agent side and mcp.server.operation.duration on the server side.
The GenAI conventions are still marked as in development, so names can change between releases. Pin your OpenTelemetry package versions, and read the release notes before upgrading.
On top of the standard names, I added a few agent.* attributes for things the conventions don't cover yet: agent.step, agent.tool.repeat, agent.tool.retry and agent.termination_reason. Keep custom names in their own namespace so they never collide with a future standard.
Step 1: instrument the LLM call
Each LLM round trip is a CLIENT span. Record the model, the token counts and the finish reason on the span, and record the same token counts on the metric. This is trimmed from agent/agent.py:
attrs = {"gen_ai.operation.name": "chat",
         "gen_ai.provider.name": llm.provider,
         "gen_ai.request.model": llm.model,
         "agent.step": step}
with tracer.start_as_current_span(f"chat {llm.model}", kind=SpanKind.CLIENT,
                                  attributes=attrs) as span:
    resp = await llm.chat(messages, tools)
    span.set_attribute("gen_ai.response.finish_reasons", [resp.finish_reason])
    span.set_attribute("gen_ai.usage.input_tokens", resp.input_tokens)
    span.set_attribute("gen_ai.usage.output_tokens", resp.output_tokens)
    token_usage.record(resp.input_tokens, {**labels, "gen_ai.token.type": "input"})
    token_usage.record(resp.output_tokens, {**labels, "gen_ai.token.type": "output"})
Tokens go on both. The span answers "why was this run expensive?" The metric answers "are we spending more than usual right now?" and is what you alert on.
Step 2: propagate context into every MCP call
This is the step most teams skip, and it's the one that turns tool servers from black boxes into part of the trace.
An HTTP client puts a W3C traceparent header on the request. MCP over stdio has no headers, but every MCP request has a params._meta object for exactly this kind of metadata. The agent injects the current trace context into a dictionary and sends it as _meta:
from opentelemetry.propagate import inject

with tracer.start_as_current_span(f"tools/call {call.name}", kind=SpanKind.CLIENT,
                                  attributes=attrs) as span:
    carrier = {}
    inject(carrier)                      # {"traceparent": "00-<trace>-<span>-01"}
    result = await session.call_tool(call.name, call.args, meta=carrier)
The MCP server reads it back and starts its SERVER span as a child of the agent's span:
from opentelemetry.propagate import extract

meta = ctx.request_context.meta
carrier = meta.model_dump(exclude_none=True) if meta is not None else {}
parent = extract(carrier)
with tracer.start_as_current_span(f"tools/call {tool}", context=parent,
                                  kind=SpanKind.SERVER, attributes=attrs) as span:
    ...
That's about ten lines in total. Without them, you'd see a tool call taking 1.5 seconds on the agent side and have no idea what happened inside the server. With them, the server's exception, its logs and its timing sit directly under the call that triggered them.
Two details that cost me time:
- Flush on the server side. A stdio MCP server is a child process, and it's often killed abruptly when the session ends. The demo flushes the span processor after each tool call so the last spans aren't lost.
- Give each tool server its own
service.name. Then Tempo's service graph draws the agent, the LLM and each tool server as separate nodes, and you can filter traces by server.
If your MCP server runs over Streamable HTTP instead of stdio, the same _meta approach works, and you can also propagate on the HTTP headers.
Step 3: count the things that predict trouble
Spans are for investigating one run. Metrics are for noticing that something is wrong across all runs. These are the metrics in the demo and the question each one answers:
| Metric | Labels | Question it answers |
|---|---|---|
gen_ai.client.token.usage |
model, token type | How fast are we spending tokens? |
agent.cost.usd |
agent, model | What does this agent cost per hour? |
agent.tool.calls |
tool, status | Which tools are failing? |
agent.tool.repeated_calls |
agent, tool | Is an agent going in circles? |
agent.runs |
termination reason | How do runs end? |
agent.run.steps |
agent | How many LLM round trips does a run take? |
mcp.client.operation.duration |
tool | How slow are the tools, from the agent's side? |
One Prometheus gotcha: increase() can't see the first increment of a counter series that is born with the value 1, because there's no earlier sample to compare it with. The first loop of the day would never fire an alert. The demo sets every counter combination to 0 at startup so the series exist before anything happens.
Step 4: put the trace ID on every log line
Logs still matter. They carry the human-readable story: "step 3 tool query_metrics failed: upstream timeout". The OpenTelemetry logging handler attaches the active trace_id and span_id to every record, and the Collector ships them to Loki over OTLP.
In Grafana, the Tempo data source links each span to its logs (Logs for this span), and the Loki data source turns trace_id into a link back to the trace. You can start from either side and land on the other in one click.
Five real-world scenarios
Each scenario below is something you'll meet in production. For the first four, there's a make target that reproduces it, so you can see exactly what the telemetry looks like before it happens to you for real.
1. A flaky upstream behind a tool
What happens. The query_metrics tool depends on a metrics API that times out. The agent gets an error, tries again, gets another error, and after three failures it falls back to the runbooks and answers with less confidence.
Reproduce it. make fail
What you see. The trace shows red tools/call query_metrics spans, each with the server-side UpstreamTimeout exception nested underneath. Each retry carries agent.tool.retry = true. The run takes 6 steps instead of 4 and costs about 60% more. Logs for this span jumps straight to the warning lines in Loki.
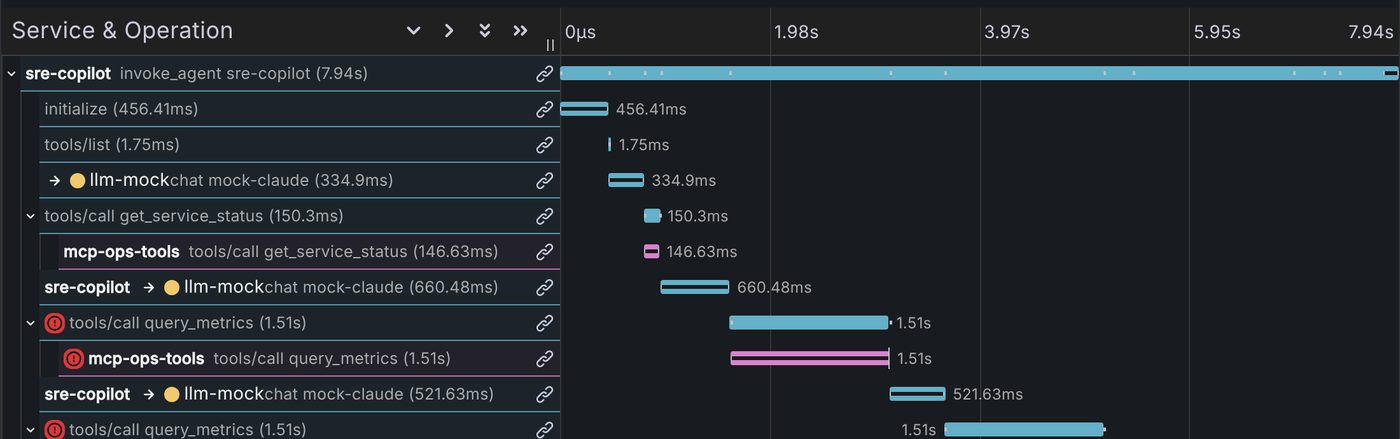
Why it matters. Without context propagation, you'd see three slow calls on the agent side and nothing else. With it, you can tell whether the tool server was slow, the upstream it calls was down, or the agent sent bad arguments.
2. A tool outage under real traffic
What happens. The metrics API is down for a few minutes. Every agent run that needs it fails the same way.
Reproduce it. make outage keeps it down for 3 minutes while background traffic continues.
What you see. The tool error rate panel climbs for query_metrics only, and the MCPToolErrorRate alert fires. Its expression is the error ratio per tool:
sum by (gen_ai_tool_name) (rate(agent_tool_calls_total{status="error"}[2m]))
  / sum by (gen_ai_tool_name) (rate(agent_tool_calls_total[2m]))
> 0.5
Why it matters. Grouping by tool tells on-call which dependency to look at, instead of "the agent is broken". Route this alert to the team that owns the tool server, not to the team that owns the agent.
3. The runaway loop
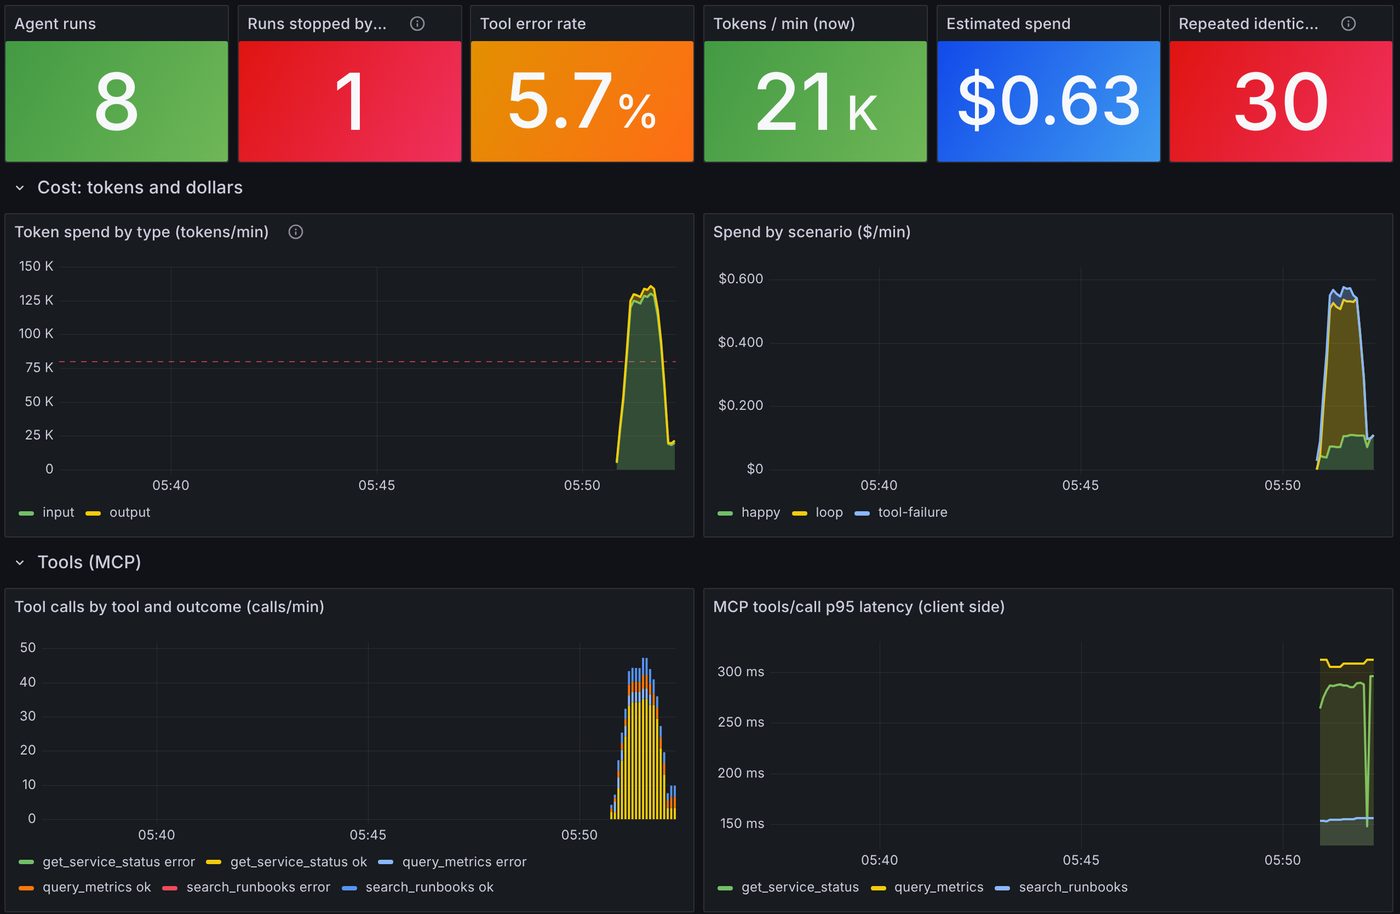
What happens. This is the story from the start of the article. get_service_status keeps returning "pending", and the agent keeps asking. Every call succeeds. Only the max_steps limit of 30 finally stops it.
Reproduce it. make loop
What you see. The trace is a long staircase of identical chat and tools/call get_service_status pairs. Every repeated tool span has agent.tool.repeat = true. Two alerts fire: RunawayAgentLoop and TokenBurnRate.
| Run | Steps | Input tokens | Cost |
|---|---|---|---|
| Healthy | 4 | ~6.1k | ~$0.03 |
| Tool failure | 6 | ~9.8k | ~$0.05 |
| Runaway loop | 30 | ~95.6k | ~$0.45 |
These are demo numbers from the mock LLM, priced at Claude Opus 5.5 list prices ($4 per million input tokens, $20 per million output). Your numbers will differ. The ratio is the point: one stuck run costs as much as fourteen healthy ones, and in a real system it can happen thousands of times a day.
There are three signals for a loop, from the cheapest to the most general:
- Repeats. A call to the same tool with the same arguments as the call right before it, when that previous call succeeded. A repeat after an error is a retry, which is often fine, so count it separately. The alert fires on more than 5 repeats in a minute.
- Steps per run. A healthy run here takes 4 LLM round trips. Watch the p95 of
agent.run.steps, because an average hides the one bad run. - Token burn. Input tokens grow every step because the whole history is re-sent. The alert fires above 80,000 tokens a minute, about four times this demo's baseline. Set yours from your own baseline.
The repeat signal is cheap and fast. Token burn is slower but catches loops the repeat detector misses, such as an agent alternating between two tools.
4. A token budget blowout
What happens. The same loop, but this time a per-run token budget stops it before max_steps does.
Reproduce it. make budget runs the loop with a 20,000-token budget.
What you see. The run ends after 11 steps with agent.termination_reason = budget_exceeded, and the root span has a guardrail.triggered event that records which guardrail fired and at what token count.
Why it matters. A budget caps the damage of failure modes you haven't thought of yet. And because the stop is recorded as telemetry, a sudden rise in budget_exceeded after a deploy is a regression signal, not a silent safety net.
5. Failures the demo doesn't simulate, but you'll meet
These follow the same patterns. Here is the signal that catches each one.
- Ping-pong between two tools. The agent alternates
get_statusandget_logsforever. The repeat counter stays at zero because no two consecutive calls are identical. Token burn and steps per run still catch it. - A slow tool, not a failing one. A tool that takes 20 seconds instead of 200 milliseconds makes every run slow without a single error. Alert on the p95 of
mcp.client.operation.durationper tool, and compare it with the server-side duration to tell network or queueing delay from slow work. - The model provider is rate limiting you. LLM spans fail with an
error.typesuch as a 429 or an overload error, andgen_ai.client.operation.durationclimbs as clients back off. Alert on the LLM error ratio separately from tool errors, because the fix is different: quota, a fallback model, or backpressure. - A model or prompt change makes runs longer. After a deploy, the p95 of steps per run moves from 4 to 7 and cost per run goes up, but nothing fails. Put the model, prompt version and agent version on the root span, and compare before and after on the same dashboard.
- An unexpected tool call. A prompt injection in a tool result, for example a support ticket with instructions in it, can steer the agent towards a tool it doesn't normally use for that task. A
gen_ai.tool.namevalue that has never appeared for that agent before is worth an alert. Observability won't stop the call; an authorization layer in front of the tool server does. Telemetry tells you it was attempted.
Guardrails should emit telemetry too
Observability tells you about the loop; guardrails stop it. The demo has three guardrails: max_steps, a loop breaker that stops after three identical calls in a row, and a per-run token budget.
Here is the same bug with and without the loop breaker:
| Configuration | Steps | Input tokens | Cost |
|---|---|---|---|
Only max_steps = 30 |
30 | ~95.6k | ~$0.45 |
Loop breaker on (make loop-guarded) |
4 | ~6.0k | ~$0.03 |
Every run ends with one of five reasons, recorded on the root span and counted on the agent.runs metric:
agent.termination_reason = completed | max_steps | loop_detected | budget_exceeded | error
Treat this as the most important attribute you add. Without it, "the agent stopped" means nothing. With it, you can chart how runs end, alert when guardrails start firing, and tell a model regression from a broken tool.
A TraceQL cookbook
TraceQL is Tempo's query language. These are the queries I keep using with this data.
// Runs that didn't complete normally
{ span.gen_ai.operation.name = "invoke_agent" && status = error }

// Runs that made more than 10 tool calls
{ span.gen_ai.operation.name = "execute_tool" && kind = client } | count() > 10

// Every repeated call, and every retry
{ span.agent.tool.repeat = true }
{ span.agent.tool.retry = true }

// LLM calls with very large contexts
{ span.gen_ai.operation.name = "chat" && span.gen_ai.usage.input_tokens > 5000 }

// Errors inside the tool server
{ resource.service.name = "mcp-ops-tools" && status = error }

// TraceQL metrics: p95 tool latency by tool
{ resource.service.name = "sre-copilot" && span.gen_ai.operation.name = "execute_tool" }
  | quantile_over_time(duration, .95) by (span.gen_ai.tool.name)
One gotcha from testing on Tempo 2.6: TraceQL metrics queries that filter on kind = client returned no series, while the same filter worked in normal search. Filtering by resource.service.name instead works in both.
Best practices before you go to production
The demo is tuned to show everything on stage. Production needs a few more decisions.
Sampling
Don't head-sample agent traces. If you keep 10% of traces chosen at the start, you'll drop the one runaway run you needed. Use tail sampling in the Collector: keep every trace with an error, every trace with more than a set number of spans, and every trace longer than a set duration, then sample the healthy rest.
Cardinality
Metric labels should be low-cardinality: model, tool name, outcome, agent name, termination reason. Never put prompt text, user IDs, session IDs or conversation IDs on a metric. Those belong on spans, where cardinality is cheap.
Content capture
Prompts, tool arguments and tool results are user data. They can contain personal information, secrets and customer records. Capture them only when you opt in, truncate them (the demo clips results to 1,000 characters), redact known secret patterns, and keep retention short. The demo turns content capture on so you can see it; turn it off by default in production.
Cost ownership
Put tokens and dollars per agent and per team on a dashboard that someone owns. Cost is a reliability metric for agents. A cost panel nobody looks at is how a loop runs all weekend.
SLOs that fit agents
Availability isn't enough. Useful service level indicators for an agent are:
- Task success rate: the share of runs that end with
completed. - Cost per successful run: total spend divided by completed runs.
- p95 steps per run: a leading indicator for loops and for prompt regressions.
- p95 time to answer: what the user actually waits for.
Alert hygiene
The demo's alerts fire immediately so you can watch them on stage. In production, add a for: duration of a few minutes, send each alert to the team that owns the failing part, and link the alert to a Grafana panel or a TraceQL query, so on-call starts from evidence.
Instrumentation hygiene
- Version everything that changes behaviour. Put the model, prompt version and agent version on the root span. When behaviour shifts, you'll want to split by them.
- Record retries and repeats separately. They mean opposite things.
- Propagate context across every hop, including sub-agents. A sub-agent run is an
invoke_agentspan under its parent, and propagation works the same way. - Prefer existing instrumentation where it fits. Libraries such as OpenLLMetry, OpenLIT and the OpenTelemetry GenAI instrumentations cover popular SDKs. I instrumented the demo by hand so every attribute is visible, but you don't have to.
- Remember what tracing can't tell you. A trace shows what the agent did and what it cost, not whether the answer was right. For correctness you need evaluations or user feedback, which you can attach to the same trace ID.
Run it with a real model
The mock LLM keeps the demo deterministic. To see how a real model behaves in the same scenarios, set your key and restart:
cp .env.example .env        # then set LLM_MODE=anthropic and ANTHROPIC_API_KEY
make up
make loop
A real model often gives up on the "pending" loop after a few polls, but not always. That variance is exactly why you alert on behaviour, not on what you expect the model to do. If a live call fails, the agent falls back to the mock and records an llm.fallback_to_mock event on the root span, so the trace says which model actually answered.
Cleanup
Everything runs in local containers. To stop the stack and delete all its data:
make down # docker compose down -v
If you used a real API key, remove it from .env when you're done.
Four things to remember
- A run is a trace. One
invoke_agentroot, with every LLM call and tool call inside it. - Propagate context into every MCP call. Ten lines of code, and your tool servers stop being black boxes.
- Alert on repeats and token burn, not just errors. The most expensive agent failure returns 200.
- Record why every run stopped. Completed, max steps, loop detected, budget exceeded or error.
The full demo, dashboard and alert rules are in observing-ai-agents-mcp. Clone it, run make up and make loop, and watch your first runaway agent get caught.