
Pod stuck in Pending? Here's how the scheduler really picks a node
The Kubernetes scheduler filters, scores and binds. Knowing which step rejected your pod turns a Pending mystery into a two-minute fix.

A pod that's Pending is a pod without a node. Nothing is broken yet. The scheduler simply hasn't found anywhere it's allowed to put it.
The good news is that the scheduler always explains itself. You just need to know how it thinks, so the explanation makes sense.
Step 1: filter
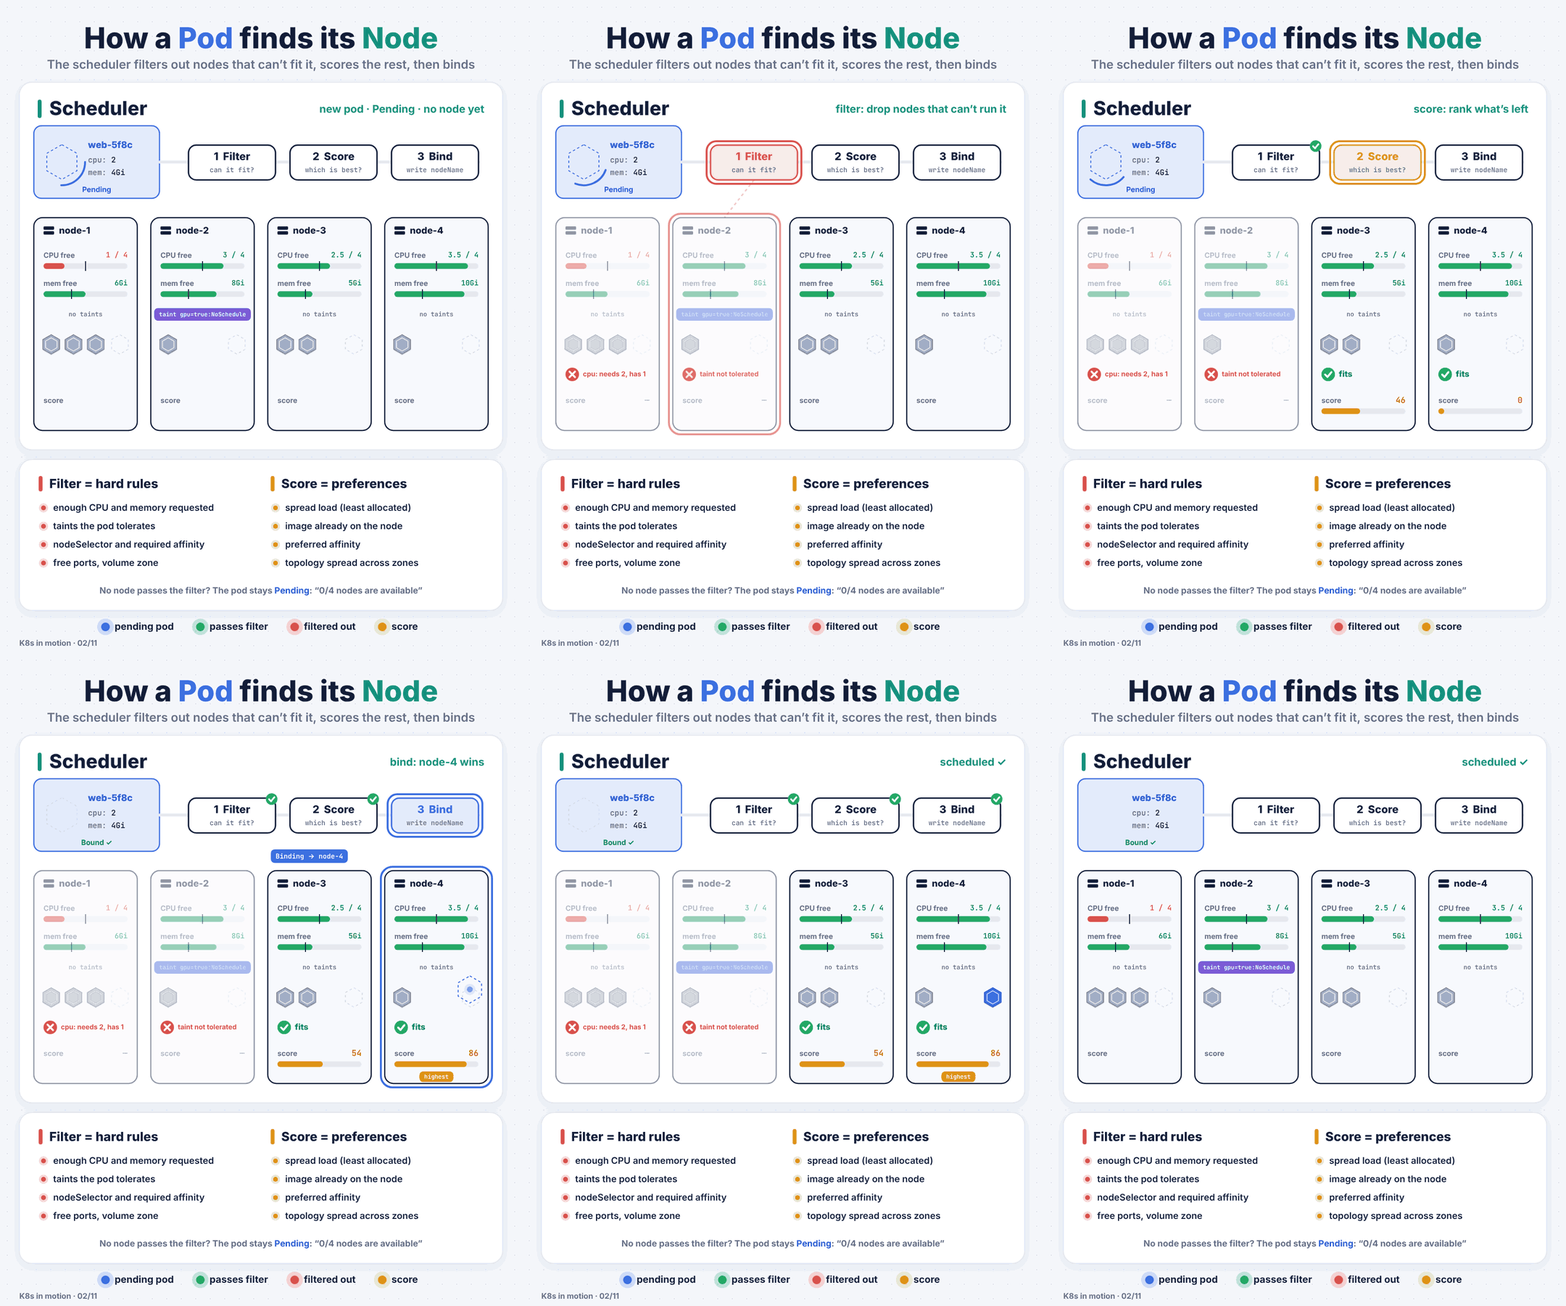
The scheduler throws out every node that can't run the pod. In the animation:
node-1has 1 CPU free, but the pod requests 2. Out.node-2has a taint the pod doesn't tolerate. Out.node-3andnode-4fit.
Filters are hard rules: resource requests, taints and tolerations, nodeSelector, required node affinity, volume zone constraints, and a few more.
Step 2: score
Every node that passed gets ranked. Scoring plugins look at how loaded the node already is, whether the container image is already pulled, preferred affinity, and spreading pods across zones. Here node-4 scores 86 and node-3 scores 54.
Scores are preferences. A low score never makes a pod Pending. Only filtering does that.
Step 3: bind
The scheduler writes nodeName: node-4 on the pod. The kubelet on node-4 notices, pulls the image and starts the container. From here on, problems are no longer scheduling problems.
Read the event, not the YAML
When nothing passes the filter, the pod's events tell you exactly why, node by node:
kubectl describe pod web-7c9d -n demo
Warning  FailedScheduling  0/4 nodes are available:
  1 Insufficient cpu,
  1 node(s) had untolerated taint {gpu: true},
  2 node(s) didn't match Pod's node affinity/selector.
Each reason maps to a filter:
| Message | What to check |
|---|---|
Insufficient cpu / Insufficient memory |
The pod's requests vs. what's allocatable. kubectl describe node shows both. |
had untolerated taint |
Either add a toleration, or the pod really shouldn't go there. |
didn't match Pod's node affinity/selector |
Labels on the nodes vs. nodeSelector or required affinity. |
had volume node affinity conflict |
The PersistentVolume is in a different zone from the available nodes. |
Too many pods |
The node hit its maxPods limit. Common with small instance types on EKS. |
If you see nothing at all, check that the scheduler is the one that's supposed to handle it. A typo in schedulerName leaves a pod Pending forever with no events.
Things worth knowing
- The scheduler uses requests, not real usage. A node at 10% CPU can still be "full" if pods requested all of it. And a pod with no requests looks free to the scheduler, which is how nodes get overloaded.
- "Required" filters, "preferred" scores.
requiredDuringSchedulingIgnoredDuringExecutioncan make a pod Pending.preferredDuringScheduling...never will. - Pending isn't always a scheduler problem. If you run Cluster Autoscaler or Karpenter, a Pending pod is often the trigger to add a node. Give it a minute before you start debugging.
# Quick view of what's actually free on each node
kubectl describe nodes | grep -A 8 "Allocated resources"